The theft of my children's summers
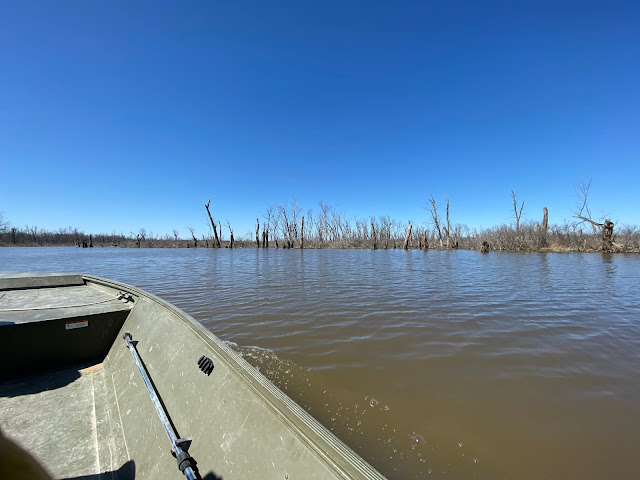
The land upon which I spent much of my youth has been stolen from me. Figuratively anyway. That land, the river backwaters and bottomland forests where I developed my love for the outdoors and from which grew the desire to pursue a career in conservation, is still there. It’s just underwater more than it should be. And because of that, many of the trees that sheltered my tent, reared wood ducks, and hid the raccoons my hounds chased, are now dead. Hundreds of acres of silver maples, willows, and cottonwoods – trees that are adapted to growing in wet conditions – drowned. It’s looking more like the Everglades, but with fewer gators.
I’ve sensed for years now that our flood patterns were changing. I finally took the time to look at the data recently and it confirmed my suspicions. Our high water, at least here in Burlington, starts later and sticks around longer than it used to. If this trend continues, there is little chance my kids, now five and two, will have much chance to enjoy those bottomlands the way I did growing up.
Stolen, indeed.
Let’s dig into the data. The data I used is publicly available at rivergages.com.
We have daily river level data going back to 1920 for places up and down the Mississippi. I only looked at Burlington’s data, because that’s where I live. It would be fun to run these same analyses for river towns above and below us, but I don’t have that kind of time. I’d love it if someone else would do that, though.
I put that data into spreadsheets and subdivided by decade. I then calculated the number of days each year the river spent above 15 feet, which is considered Burlington’s flood stage. For instance, for the decade of the 1920’s, the river exceeded flood stage for four days in 1922. That’s it. In fact, that was the only flooding it did between 1920 and 1939. In the 1980’s by contrast, the decade I was born (1982), the river flooded every year between 1982 and 1986, ranging from only 14 days in 1985 to 75 days above flood stage in 1986.
I did this for every decade for 100 years. I then looked at the number of days per year the river spent above flood stage, averaged by decade. Here’s where the data confirmed what anyone that owns riverfront property already knew. That average has been increasing, and dramatically so since about 2000. The average took a big jump just this past decade.
Looking ahead, I suspect we’re only seeing the beginning of this trend. I hope I’m wrong, but we should be prepared for more floods of longer duration, more record-setting crests, and the peak of those floods coming later in the year. I see less floods caused by snow melt and more from summer monsoons. I see a new normal that we don’t have to like, but must accept, nonetheless. Again, I hope I’m wrong but if I’m not, we’re in for a wet ride.
Good thing my kids like boat rides.
 |
| What used to be healthy bottomland forest is now a collection of rotting skeletons. The tree loss in these backwaters where I spent much of my youth has been near total. |
I’ve sensed for years now that our flood patterns were changing. I finally took the time to look at the data recently and it confirmed my suspicions. Our high water, at least here in Burlington, starts later and sticks around longer than it used to. If this trend continues, there is little chance my kids, now five and two, will have much chance to enjoy those bottomlands the way I did growing up.
Stolen, indeed.
Let’s dig into the data. The data I used is publicly available at rivergages.com.
We have daily river level data going back to 1920 for places up and down the Mississippi. I only looked at Burlington’s data, because that’s where I live. It would be fun to run these same analyses for river towns above and below us, but I don’t have that kind of time. I’d love it if someone else would do that, though.
I put that data into spreadsheets and subdivided by decade. I then calculated the number of days each year the river spent above 15 feet, which is considered Burlington’s flood stage. For instance, for the decade of the 1920’s, the river exceeded flood stage for four days in 1922. That’s it. In fact, that was the only flooding it did between 1920 and 1939. In the 1980’s by contrast, the decade I was born (1982), the river flooded every year between 1982 and 1986, ranging from only 14 days in 1985 to 75 days above flood stage in 1986.
I did this for every decade for 100 years. I then looked at the number of days per year the river spent above flood stage, averaged by decade. Here’s where the data confirmed what anyone that owns riverfront property already knew. That average has been increasing, and dramatically so since about 2000. The average took a big jump just this past decade.
Until about 1960, the average number of days we spent above flood stage in any given year was in the single digits. In the 1960’s it went up to 12.8. Those of you that have been around long enough probably remember the first “great flood” of 1965. The river hit a then-record crest of 21 feet. We spent 39 days above flood stage that year.
In the 1970’s, the average days above flood stage jumps to 21.5. Another “great flood” in 1973 set a new record crest of 21.5 feet and new record days above flood stage of 80.
The 1980’s were fairly dry, yet the average days above flood stage fell just shy of 19. Only 1986 landed that decade in the record books, this time with a crest in October of 19.02 feet and 75 days above the flood mark.
Then the ‘90’s and the first “great flood” that most of us younger generation remember. That “500 Year Flood” set two record crests, one in April at 20.4 and one in July of 25.10 and left us above flood stage for an average-wrecking 151 days. For the decade, our average days above flood stage per year jumped to 34.5. But if you throw out the anomalous year of 1993, it would only be 21.5, closer to that of the previous two decades.
Here is also where we start to see a shift in flood timing. The river rises come later and stay longer. Prior to the 1990’s, there were six record-setting floods. All of them, except 1986’s October flood, crested in April or early May. There have been 13 record setting floods since then, beginning in 1993. Of those, as many of them peaked in June and July as in April and May.
Record crests that flood cities get the media attention. But extended periods of high water is what destroys the ecology of bottomlands and reduces the recreational value of riverfronts and cabin lots. So back to the data. The 2000’s brought us three of the top ten crests of all time, sixth place in 2001 at 21.82 feet and 57 days above flood stage. But then 2008 took positions nine (21.18 feet in May) and the still-current record of 25.73 feet in June. That year we spent 75 days above flood stage.
But 2005 and 2006 were dry, with zero days above flood stage resulting in a decade average of only 23 days annually. What’s interesting here though is that if you remove that one crazy year of 2008, the decade average for days above flood stage drops below 20.
But that all changes significantly in the modern era. For the decade of the 2010’s, only 2012 left us below flood stage for the year. The rest of the years logged double digits for an astounding decade average of 71.8 days above flood stage annually. The average is skewed by 2019 where we set a new record of 169 days above flood stage and a third highest crest of all time at 24.48 feet. For record crests, the 2010’s have not been nice to us. Four of the top ten crests of all time were set then, one each in April, June, July, and October (only the second time a fall crest made the record books).
We can’t even reconcile the average by eliminating the outlier this time either. Unlike in previous decades, if we remove the bad year of 2019, the average only drops to 61 days above flood stage per year, which is still two or three times higher than the previous four decades, even with their outliers left in place.
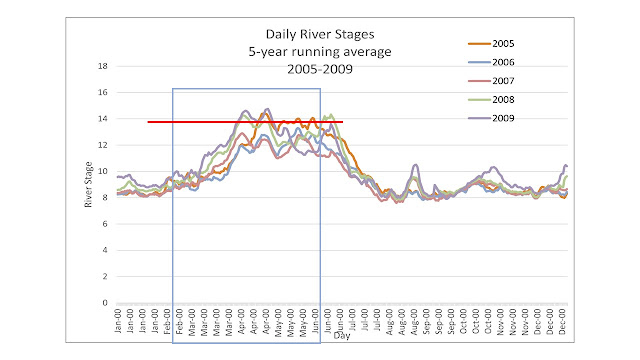
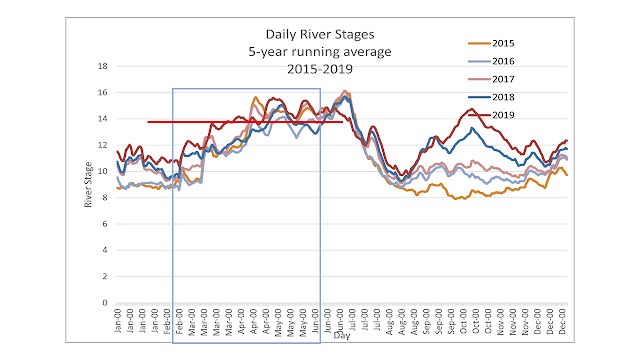
The timing is what’s really disturbing to me, though. Looking at 5-year running averages from the 1980’s to today, it’s clear that the timing of high water has shifted later and is lasting longer. It used to be that the water would rise in the spring, peak out around April, and be back down by about the time school let out for the summer. Thus, kids like me could generally spend summers at their cabin on the river.
But now the trend seems to be that the river makes a slow rise through spring then stays high from mid-April clear into mid-July or later with our peak crests coming in June and July.
So much for summer fun on the river.
Here are some graphs of the 5-year running average of daily river stages going back to the 1980's. The blue box in the first graph is the typical "spring flood" as it was in the 1980's. The red line is my estimation of the midpoint of the flood height for that timeframe. The box and line don't move in the subsequent graphs, they stay exactly where they were in the 1985-1989 graph to use as a reference point.
 |
| The early 90's saw two bumps again, with a big summer bump, largely thanks to 1993. |
 |
| Into the 2000's, notice how the spring and summer floods have essentially combined to result in an extended high water regime that extends off the blue box. |
 |
| The "one long flood" situation persists into the late 2000's, though the heights were lower. Notice the timing continuing well into summer. |
 |
| The 2010's show a rapid spring rise, and a bit more that two-peak regime we saw in the early graphs. But still persisting later and higher. |
 |
| Into the most recent years, we're still seeing a prolonged flood lasting longer into summer, with the most recent years showing significant flooding in the fall. |
I don’t have time today, nor do I yet have the data to get into why this might be happening. But it’s certainly happening and it has profound ecological implications, as I have seen first-hand. Not to mention the impacts it has on recreation and the community at large. How many of these new summer floods did it take to kill Steamboat Days? How much have Burlington and countless other river towns invested in flood protection? How many river rats, cabin owners, and other outdoorsmen/women have been affected by this? Everybody talks about record-setting crests but aside from the few of us that are directly affected by it, I hear little to no talk about the extended high water we're seeing. That it has literally deforested hundreds, maybe thousands of acres of bottomlands up and down this pool seems like someone should care, family gatherings be damned.
But I digress.
Looking ahead, I suspect we’re only seeing the beginning of this trend. I hope I’m wrong, but we should be prepared for more floods of longer duration, more record-setting crests, and the peak of those floods coming later in the year. I see less floods caused by snow melt and more from summer monsoons. I see a new normal that we don’t have to like, but must accept, nonetheless. Again, I hope I’m wrong but if I’m not, we’re in for a wet ride.
Good thing my kids like boat rides.


Comments
Post a Comment